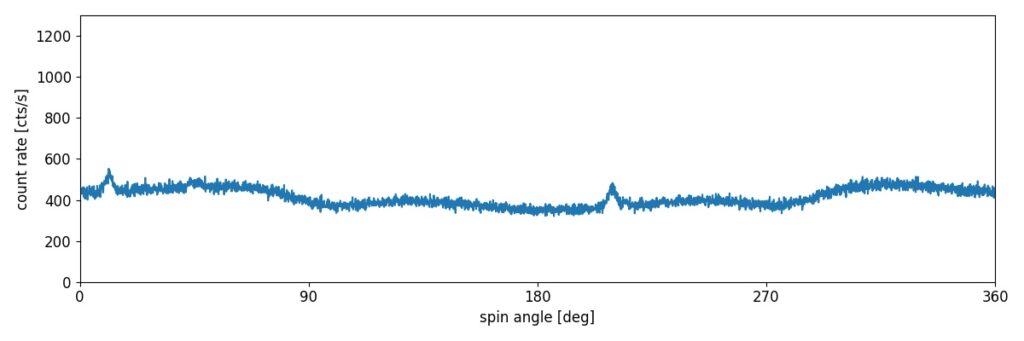
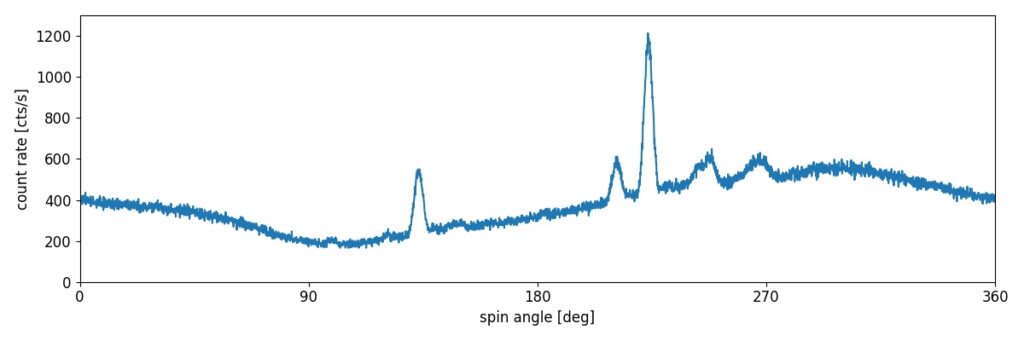
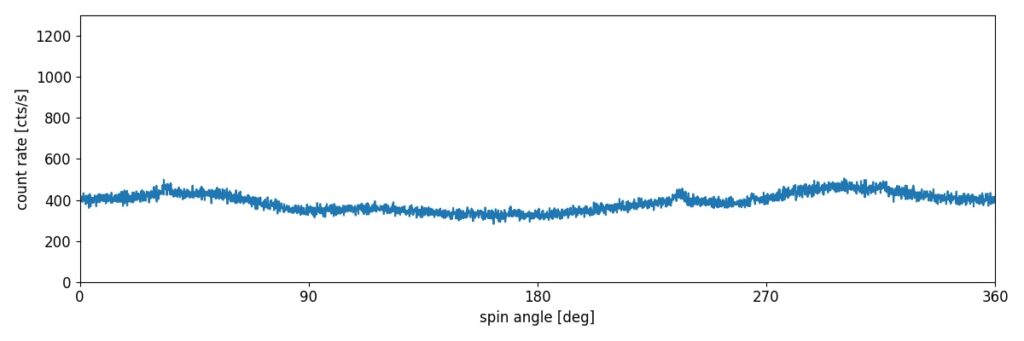
GLOWS will observe helioglow by scanning a strip on the sky of radius of 75. A product of daily observations is a lightcurve of the helioglow intensity, collected from the scanning circle and composed of registered counts of the instrument, accumulated in bins organized by spin angle of the spacecraft.
An example lightcurve for simulated data can be seen on Figures 1-3. Level of the signal, as well as the modulation, depends on the location of the observer with respect to the Sun, which is connected with the time of observation during the year. Apart from helioglow GLOWS will see a signal from a bright stars (it is visible in Figure 2, where the scanning circle crosses the Galactic plane and a lot of stars are within detector’s field of view).